Splunk - SIEM

This documentation covers the setup, installation, and usage of Splunk, a fully functional system in Splunk that autonomously monitors and responds to security threats, providing timely alerts and comprehensive incident documentation for effective cybersecurity management.
Objective: To implement automated security monitoring and incident response within Splunk, focusing on ModSecurity alerts, to enhance threat detection and streamline incident documentation for improved cybersecurity posture.
Outcome: To create a fully functional system in Splunk that autonomously monitors and responds to security threats, providing timely alerts and comprehensive incident documentation for effective cybersecurity management.
Preface
In today’s dynamic cybersecurity environment, organizations face an unprecedented level of threats, ranging from sophisticated cyberattacks to insider risks and inadvertent data breaches. This escalating threat landscape necessitates robust security measures to protect critical assets, ensure regulatory compliance, and maintain operational continuity. Security Information and Event Management (SIEM) solutions have emerged as essential components of modern cybersecurity strategies, providing organizations with the ability to aggregate, correlate, and analyze vast volumes of security data from disparate sources in real-time.
Among SIEM platforms, Splunk has established itself as a leading solution, renowned for its advanced analytics capabilities and comprehensive approach to security monitoring. By leveraging Splunk, organizations can gain deep insights into their IT infrastructure, identify security incidents rapidly, and orchestrate effective incident response workflows. Splunk’s versatility and scalability make it well-suited for organizations of all sizes, offering customizable dashboards, real-time alerting, and integration with a wide range of security tools.
With Splunk, organizations can achieve proactive threat detection, rapid incident response, and continuous security monitoring across their entire IT ecosystem. By centralizing security data and automating routine tasks, Splunk empowers security teams to focus their efforts on high-priority threats, reducing response times and minimizing the impact of security incidents. As the cybersecurity landscape continues to evolve, Splunk remains at the forefront, enabling organizations to stay ahead of emerging threats and protect their digital assets effectively.
In conjunction with a PhpMyAdmin page secured by ModSecurity web application firewall, Splunk will play a crucial role in monitoring and safeguarding the application’s security posture. By ingesting and analyzing ModSecurity logs, Splunk will provide real-time visibility into potential security threats, such as SQL injection attacks or cross-site scripting (XSS) attempts. Through customized dashboards and alerting mechanisms, Splunk will enable proactive detection of suspicious activities, allowing security teams to respond swiftly and effectively to mitigate risks and protect the integrity of the PhpMyAdmin application.
Basic Setup and Configuration
Spunk Enterprise Setup
Splunk setup is straightforward and can be achieved easily in most operating systems. For this project we will be deploying Splunk Enterprise in a Kali Linux environment, a Linux distribution that is centered on security.
First, we can receive the appropriate package for our Linux distribution from the Splunk website; because we are using Kali Linux, we must choose the Debian package. Once the download has completed, we can navigate to the directory where the package is located and proceed to install it via the command line:
sudo dpkg -i <splunk_package>

# dpkg: command-line tool to install, build, remove, and manage Debian packages
# -i: Option that specifies that you want to install a package
During installation there will be a few prompts, such as accepting the End User Agreement License, and the creation of a username and password to be used to access the Splunk Web Interface
After installation, we can start Splunk Enterprise using the following command:
sudo /opt/splunk/bin/splunk start

# Optionally, you can set Splunk to autorun at startup:
sudo /opt/splunk/bin/splunk enable boot-start
The Splunk Web Interface can be accessed via your preferred web browser by navigating to ‘http://localhost:8000’ and using the corresponding login info created during the installation process.
Next, we will set up our Splunk Enterprise to listen for incoming data from forwarders. This can be done via the Splunk Web Interface:
- Settings → Forwarding and receiving.
- Configure receiving → New Receiving Port
- Enter a port number and save - The default is 9997
Additionally, you can also do this via the command line with the following code:
sudo /opt/splunk/bin/splunk enable listen 9997 --accept-license
Splunk Universal Forwarder Setup
The Universal Forwarded can be obtained from the Splunk website, and requires the creation of an account. We will be installing this forwarder on an Ubuntu 22.04 virtual machine, so we must select the Debian package. Once the download has finished, we can navigate to the directory with the file and use the following to install the Universal Forwarder:
sudo dpkg -i <splunk_forwarder_file>
After, we start the Universal Forwarder and accept the license agreement:
sudo /opt/splunkforwarder/bin/splunk start --accept-license

# Optionally, you can set Splunk to autorun at startup
sudo /opt/splunkforwarder/bin/splunk enable boot-start

# You might need to stop Splunk momentarily for the autorun modification
sudo /opt/splunkforwarder/bin/splunk stop
Net we must modify the Universal Forwarder so that it sends data to our Splunk Enterprise instance on Kali Linux:
sudo /opt/splunkforwarder/bin/splunk add forward-server <Kali_IP>:<listening_port>

# Substitute the <Kali_IP> field with the corresponding IP address of your virtual machine
# Substitute <listening_port> field with the listening port of your Splunk Enterprise instance
	# By default, this port is 9997, or whichever port you choose
Now that our Ubuntu virtual machine is sending data, we must specify which log files should be fed to our Splunk Indexer. For testing purposes, you can start with syslog or auth.log, but feel free to add logs according to your purposes:
# monitor syslog
sudo /opt/splunkforwarder/bin/splunk add monitor /var/log/syslog

#monitor auth.log
sudo /opt/splunkforwarder/bin/splunk add monitor /var/log/auth.log
Then we can restart the Universal Forwarded to apply the configurations:
sudo /opt/splunkforwarder/bin/splunk restart
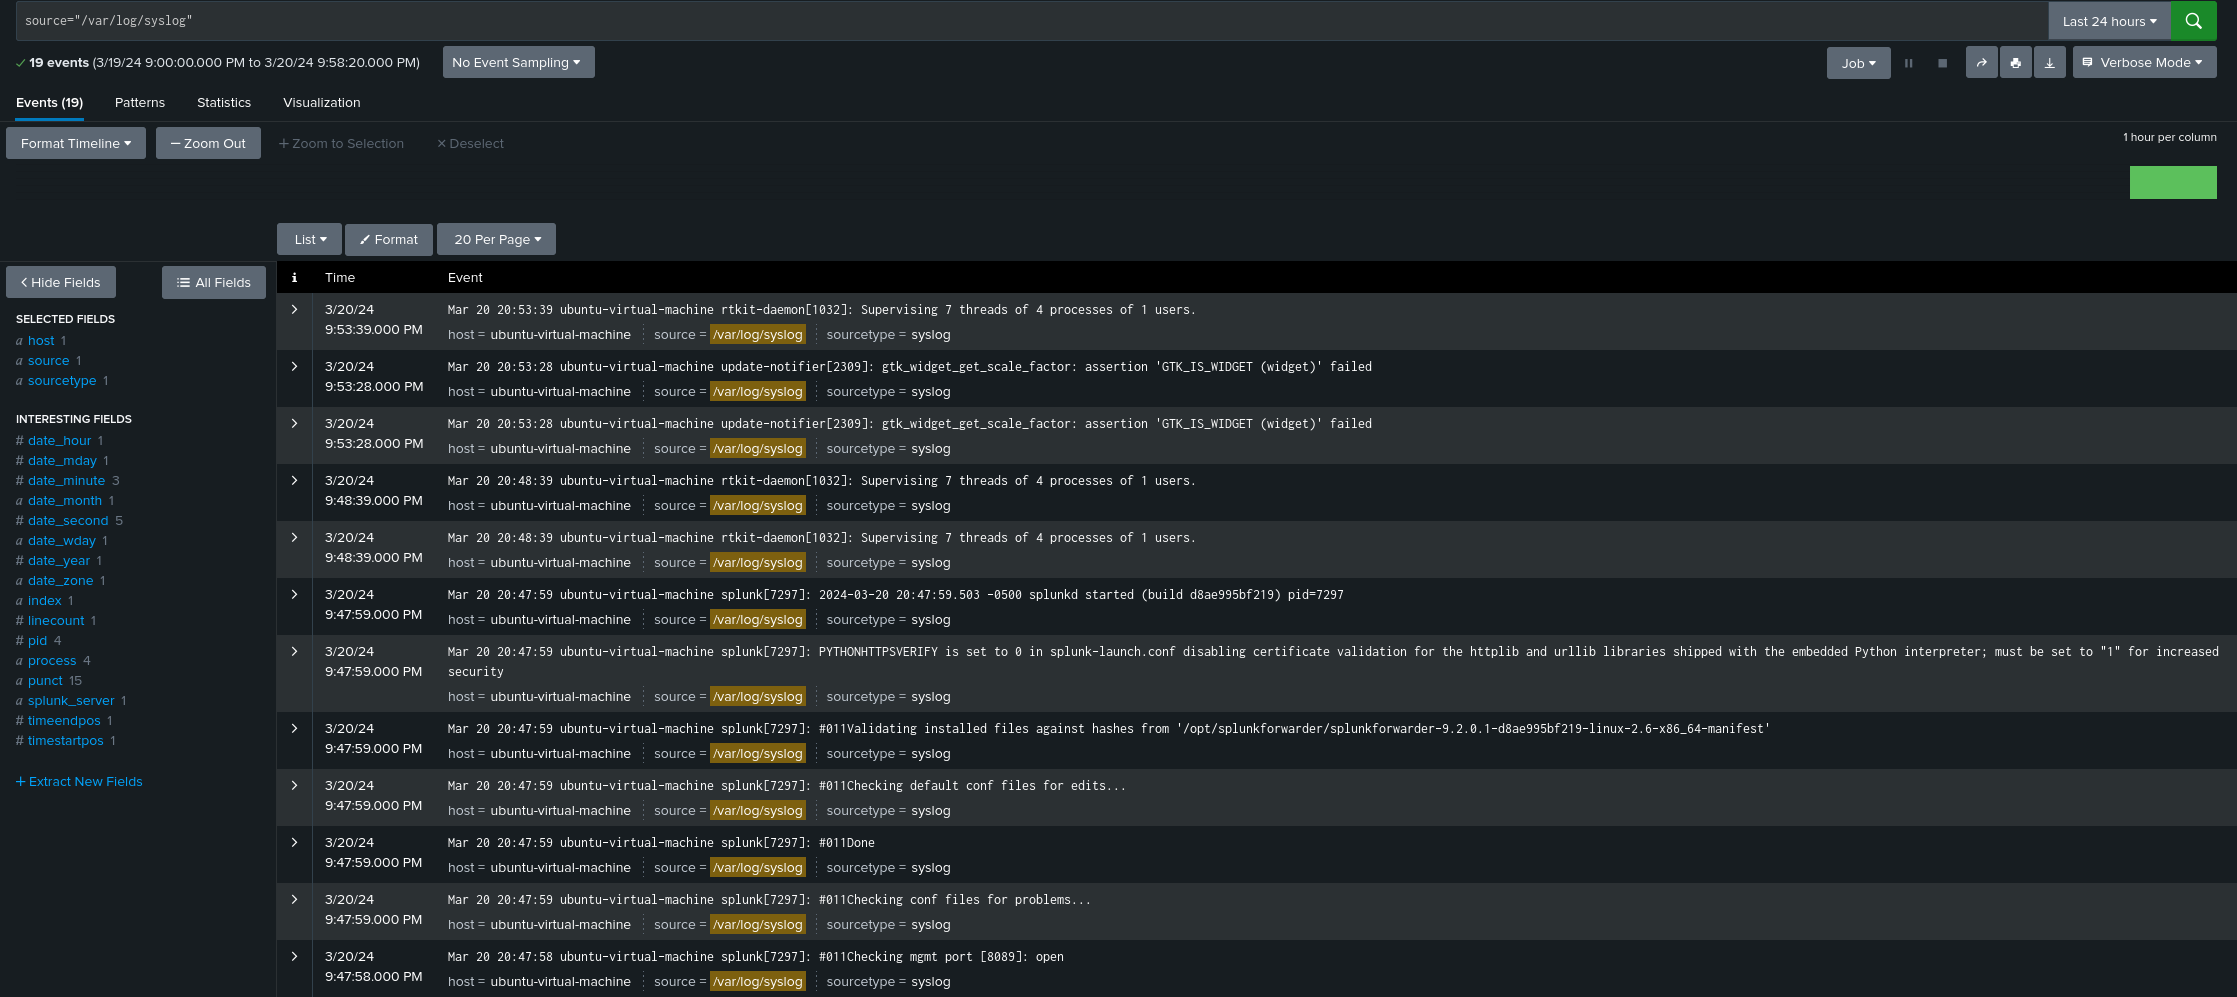
To confirm that our forwarder is working properly, we can head over to our Splunk Web Interface and select the Search and Reporting app and input one of the directories we are monitoring:
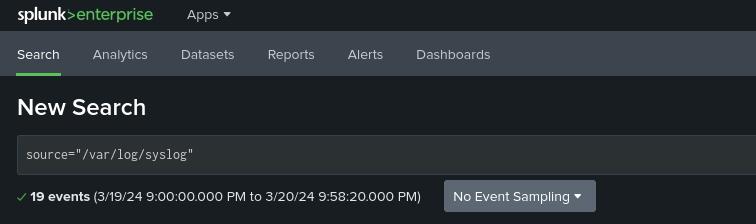
This should produce a plethora of events that can be further analyzed:
Optionally, we can make sure that our Universal Forwarder autoruns on start:
# Enable Splunk Forwarder Service to start at Boot:
sudo systemctl enable SplunkForwarder.service

# Start service:
sudo systemctl start SplunkForwarder.service

# Verify the service is running:
sudo systemctl status SplunkForwarder.service
phpMyAdmin
phpMyAdmin is a free, PHP-based tool for managing MySQL or MariaDB servers, offering a wide range of database administration tasks through its web interface. It supports creating and modifying databases, tables, and indexes, executing SQL statements, managing user accounts and privileges, and much more, making it an essential tool for web developers and database administrators.
Integrating phpMyAdmin with a Web Application Firewall (WAF) allows for a strategic approach to generating and analyzing security logs. By simulating attack scenarios or detecting real threats through the WAF while managing database operations with phpMyAdmin, we can gather valuable security data. This data, when fed into Splunk, enables in-depth analysis and monitoring of security events, facilitating timely detection and response to vulnerabilities and threats. This methodology not only enhances security posture but also provides practical insights into the effectiveness of current security measures.
In the following section we will install and setup phpMyAdmin, this will be done on our Ubuntu endpoint.
First, we must install apache2, a widely used web server software that is typically used for serving websites on the internet:
sudo apt install apache2 -y

# -y : automatically approves any prompts while installing
Then we can install the mysql-server package, the backbone of our phpMyAdmin tool:
sudo apt install mysql-server -y
After we can install some dependences, modules, and extensions:
sudo apt install php libapache2-mod-php php-mysql

# libapache2-mod-php : integrates PHP into Apache
# php-mysql : provides PHP extension of MySQL support
Once this has been done, we can install phpMyAdmin and some required packages:
sudo apt-get install phpmyadmin php-json php-curl php-mbstring php-zip php-gd
Select the default options and setup a password for phpMyAdmin, and once these finishes, we can proceed to enable a required module, followed by a restart of the service:
sudo phpenmod mbstring
sudo systemctl restart apache2
From here, we can create a MySQL User and provide it with the appropriate privilege:
# Enter mysql database with root privileges
mysql -u root

# Show databases to confirm existence of phpmyadmin database
show databases;

# Create a secure user
	# Substitute <username> and <password> appropriately
CREATE USER '<username>'@'localhost' IDENTIFIED WITH caching_sha2_password BY '<password>';

#  Grant privileges to create user
	# Substitute <username> with chosen name
GRANT ALL PRIVILEGES ON *.* TO '<username>'@'localhost' WITH GRANT OPTION;

# Exit mysql interface
exit
Next we must include the phpMyAdmin Apache configuration files within the Apache configuration files, because these are by default in two separate files. This can be done by adding the appropriate directory within the /etc/apache2/apache2.conf file:
# Use preferred text editor to modify apache2.conf file
nano -l /etc/apache2/apache2.conf

# Include the following within this file:
Include /etc/phpmyadmin/apache.conf

# Apply the configurations by restarting the service:
sudo systemctl restart apache2
After restarting the service, you should be able to access the phpMyAdmin page through your web browser at page “
ModSecurity
ModSecurity is an open-source Web Application Firewall engine for Apache, IIS, and Nginx. It’s designed to protect web applications from various attacks, providing capabilities for HTTP traffic monitoring, logging, and real-time analysis. As the most widely deployed WAF, ModSecurity supports a range of functionalities to secure web applications effectively. This WAF will help secure our phpMyAdmin page, all the while providing logging data that can be fed into our Splunk Indexer via the Universal Forwarder.
As of March 2024, there are two versions of ModSecurity, ModSecurity2 and ModSecurity3. If we want to use the most current OWASP Core Rule Set in conjunction with ModSecurity, then we should use the most recent version, ModSecurity3. To do so, we must compile it from the source:
# Download ModSecurity3 source code:
wget https://github.com/SpiderLabs/ModSecurity/releases/download/v3.0.6/modsecurity-v3.0.6.tar.gz

# Extract the source code:
tar xzf modsecurity-v3.0.6.tar.gz

# Navigate to the corresponding directory, configure, compile, and install source code:
cd modsecurity-v3.0.6
./build.sh
./configure
make
make install
For ModSecurity3, we must also install the ModSecurity Apache connector which provides a communication channel between Apache and libModsecurity:
# Install git if necessary:
sudo apt install git

# Clone git repository for ModSecurity Apache connector:
cd ~
git clone https://github.com/SpiderLabs/ModSecurity-apache

# Move to corresponding directory
cd ModSecurity-apache

# Install ModSecurity-apache
./autogen.sh
./configure --with-libmodsecurity=/usr/local/modsecurity/
make
make install
Next, we must configure Apache to interact correctly with the Modsecurity Apache connector module:
# Append modsececurity3 modules into Apache's main configuration file:
echo "LoadModule security3_module /usr/lib/apache2/modules/mod_security3.so" | sudo tee -a /etc/apache2/apache2.conf

# Create ModSecurity configuration directory:
sudo mkdir /etc/apache2/modsecurity.d

# Copy ModSecurity configuration file to newly created directory
	# Note to choose the corresponding /home directory
sudo cp ~/modsecurity-v3.0.6/modsecurity.conf-recommended /etc/apache2/modsecurity.d/modsecurity.conf

# Copy unicode.mapping file to newly created directory:
sudo cp ~/modsecurity-v3.0.6/unicode.mapping /etc/apache2/modsecurity.d/

# Turn on ModSecurity:
sed -i 's/SecRuleEngine DetectionOnly/SecRuleEngine On/' /etc/apache2/modsecurity.d/modsecurity.conf

# Create rules file
touch /etc/apache2/modsecurity.d/modsec_rules.conf

# Include corresponding rules:
cat > /etc/apache2/modsecurity.d/modsec_rules.conf << 'EOL'
Include "/etc/apache2/modsecurity.d/modsecurity.conf"
Include "/etc/apache2/modsecurity.d/owasp-crs/crs-setup.conf"
Include "/etc/apache2/modsecurity.d/owasp-crs/rules/*.conf"
EOL
Next, we can install the OWASP Rules that our ModSecurity will be using to secure our phpMyAdmin page:
# Clone Core Rule Set:
git clone https://github.com/SpiderLabs/owasp-modsecurity-crs.git /etc/apache2/modsecurity.d/owasp-crs

# Rename crs-setup.conf.example -> crs-setup.conf
sudo cp /etc/apache2/modsecurity.d/owasp-crs/crs-setup.conf{.example,}
Then we can enable this Core Rule Set by editing the /etc/apache2/modsecurity.d/owasp-crs/crs-setup.conf :
# Comment the following two lines:
SecDefaultAction "phase:1,log,auditlog,pass" -> #SecDefaultAction "phase:1,log,auditlog,pass"
SecDefaultAction "phase:2,log,auditlog,pass" -> #SecDefaultAction "phase:2,log,auditlog,pass"

#Uncomment the following two lines:
#SecDefaultAction "phase:1,log,auditlog,deny,status:403" -> SecDefaultAction "phase:1,log,auditlog,deny,status:403"
#SecDefaultAction "phase:2,log,auditlog,deny,status:403" -> SecDefaultAction "phase:2,log,auditlog,deny,status:403"
Finally, we can activate ModSecurity3 with all our modifications done:
# Optionally create a backup file:
cp /etc/apache2/sites-available/000-default.conf{,.old}

# Modify Apache web server's default site configuration file:
cat > /etc/apache2/sites-available/000-default.conf << 'EOL'
<VirtualHost *:80>
	modsecurity on
	modsecurity_rules_file /etc/apache2/modsecurity.d/modsec_rules.conf
	ServerAdmin webmaster@localhost
	DocumentRoot /var/www/html
	ErrorLog ${APACHE_LOG_DIR}/error.log
	CustomLog ${APACHE_LOG_DIR}/access.log combined
</VirtualHost>
EOL

# Optionally. you can check Apache for any configuration errors:
apachectl -t

# Restart Apache service
systemctl restart apache2
Because of how we setup our phpMyAdmin page, we must modify our /etc/phpMyAdmin/apache.conf file to allow for symbolic links:
# Open corresponding file:
nano -l /etc/phpmyadmin/apache.conf

# Change the following line:
Option SymLinksIfOwnerMatch -> Options Indexes FollowSymLinks

# Restart Apache service
systemctl restart apache2
One further note is that under one of the ModSecurity rules, we cannot enter our phpMyAdmin by entering ‘
From here, we can perform some simple tests to see if our ModSecurity rules are in effect, and if there is active logging being performed. For this, we will do a simple SQL injection at our phpMyAdmin login page.
SQL injection is a cyber-attack technique that targets data-driven applications by exploiting vulnerabilities in the application’s software. It involves inserting or ‘injecting’ SQL queries via input data from the client to the application. Successfully executed, these injections can read sensitive data from the database, and even issue commands to the operating system. SQL injection attack can compromise the security, integrity, and availability of the information systems, making it a critical threat to web application security.
In our login page, in the username field, we can try the following:
The expression ‘OR ‘1’=’1 is a common SQL injection technique used to manipulate SQL queries. This condition is always true, leading the SQL statement to unintentionally grant access or reveal sensitive data. Attackers use it in input fields hoping the application improperly sanitizes user input, allowing unauthorized database operations.
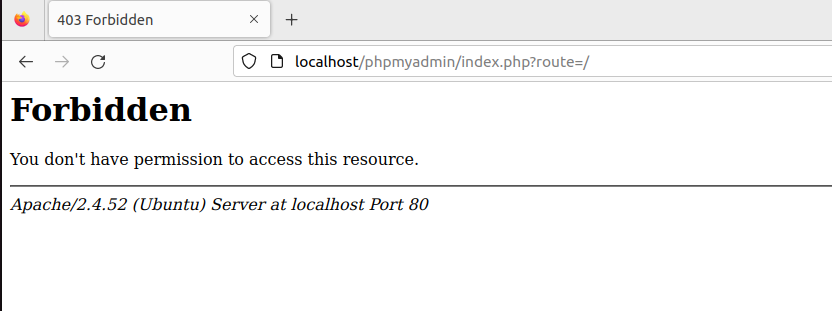
If our security configurations are working correctly, we should be redirected to another page that states we do not have access:
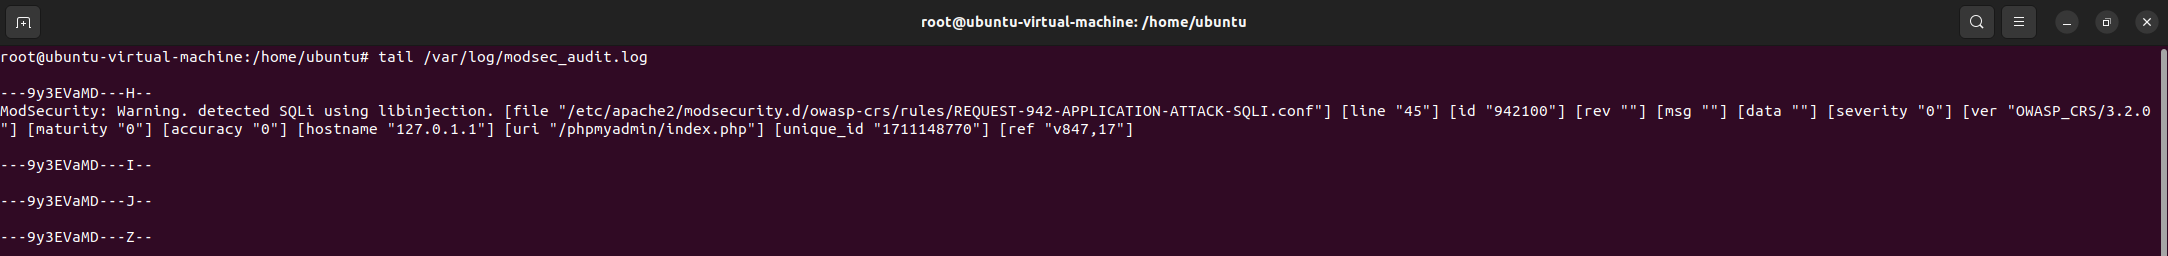
Then we can check our ModSecurity logs to see if this SQL injection attempt was logged accordingly:
tail /var/log/modsec_audit.log
This command should output the following lines detailing the attempted attack:
Now that we have confirmed that our logs our working correctly, we can feed this log file to the Splunk Indexer:
sudo /opt/splunkforwarder/bin/splunk add monitor /var/log/modsec_audit.log
Now our Splunk Web Interface should display the logs accordingly:
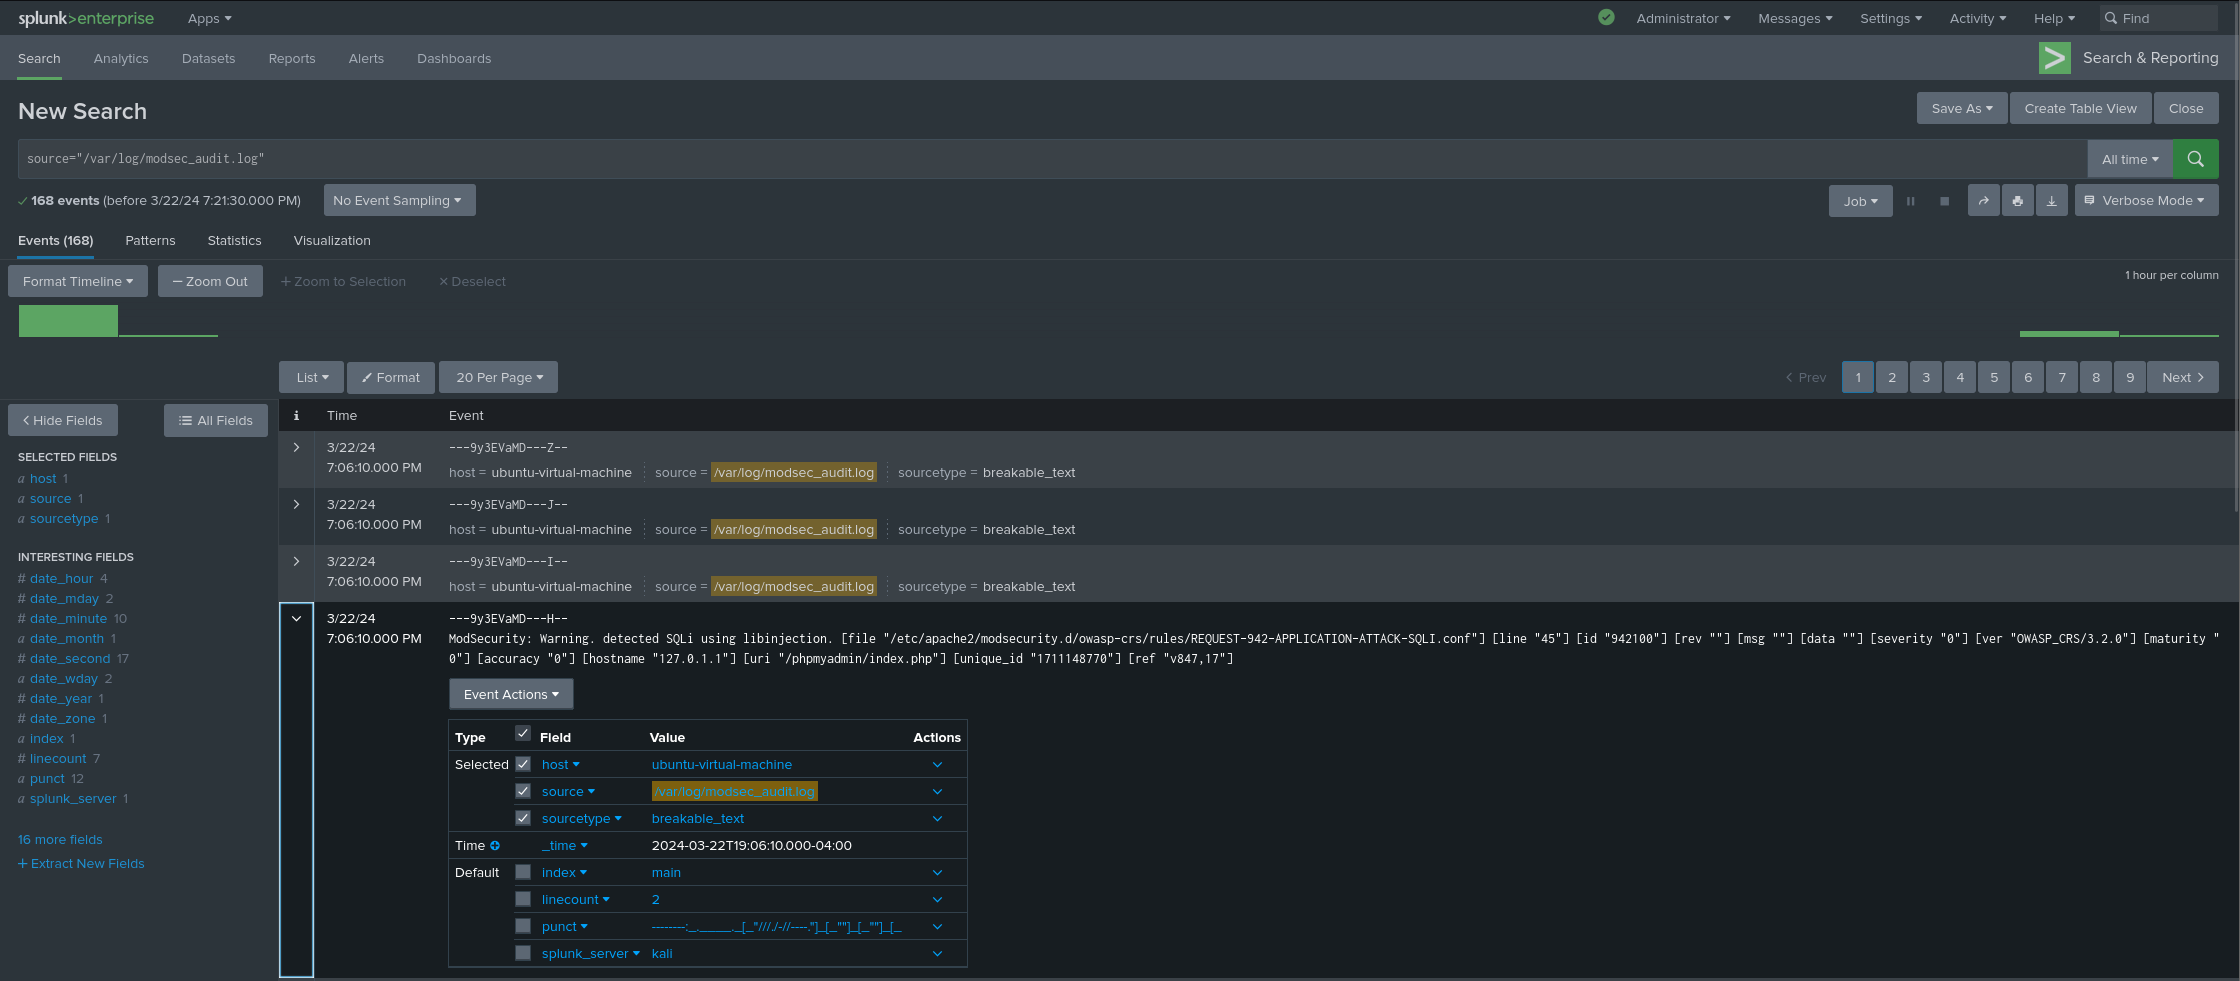
We have only done one simple SQL injection test to generate logs, but to be able to create more comprehensive Splunk searches and alerts, we must have more logging data.
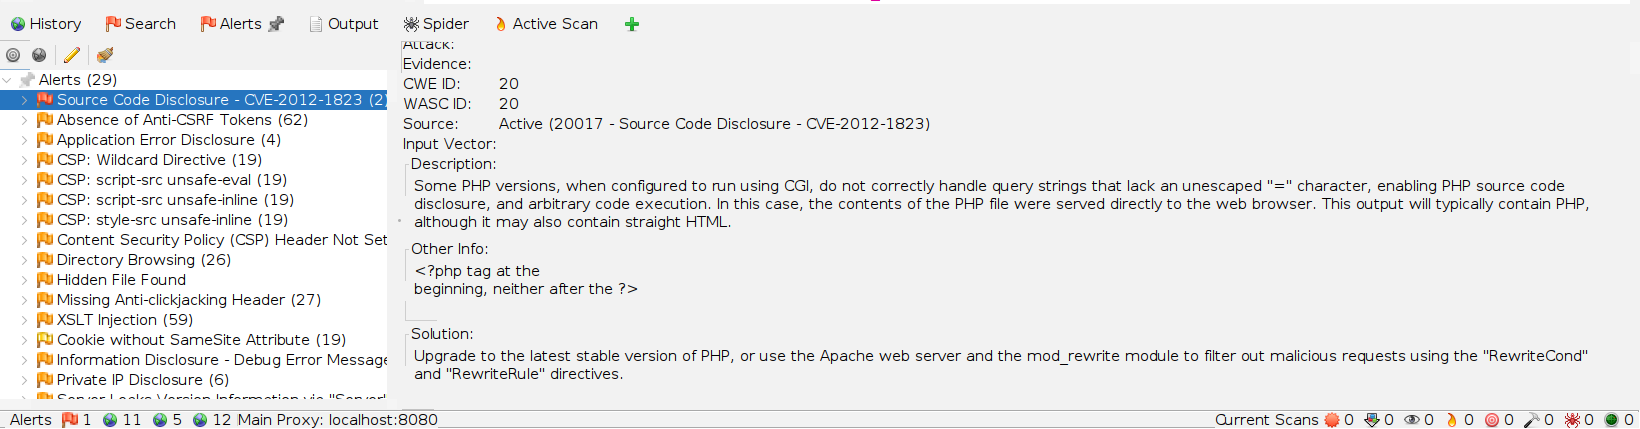
Scanning Tools
Scanning tools like Nessus and ZAP play a crucial role in assessing security configurations by systematically examining networks, systems, and web applications for vulnerabilities. These tools automate the process of detecting potential security weaknesses, misconfigurations, and known vulnerabilities, providing detailed insights and recommendations for remediation. Their ability to simulate various attack scenarios helps organizations strengthen their security posture against potential threats, making them indispensable in the proactive management of cybersecurity risks.
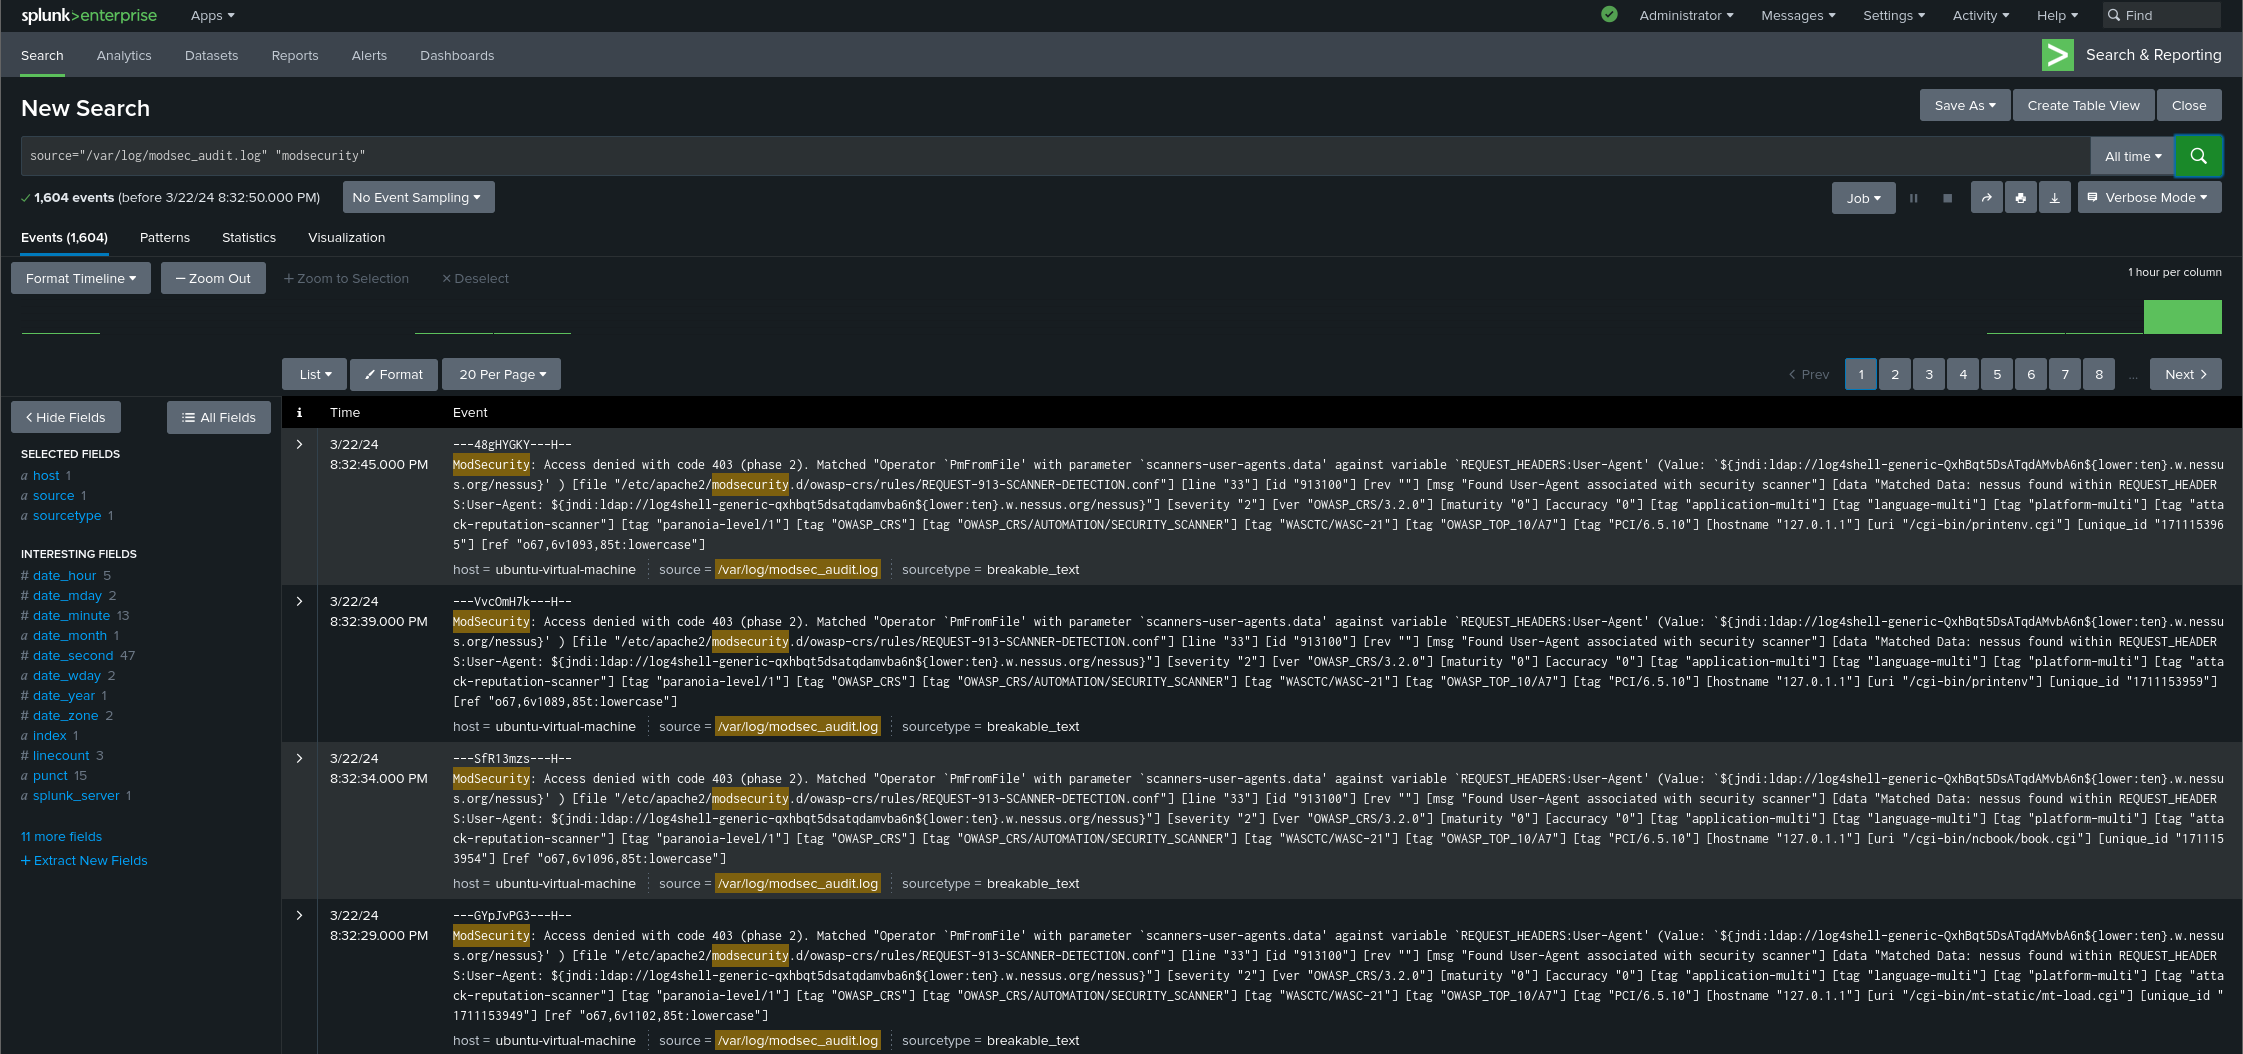
By leveraging scanning tools like Nessus and ZAP to intentionally probe systems and web applications, we can generate a significant amount of ModSecurity logs. These logs, when ingested into a Splunk Indexer, can offer detailed insights into how the defensive mechanisms respond to various attack vectors.
Nessus
Nessus can be downloaded from the Tenable website, and can then be installed and started using the following commands:
# Install Nessus
dpkg -i <nessus_file>

# Start Nessus Scanner
/bin/systemctl start nessusd.service #OR systemctl start nessusd
From here, we can access the Nessus interface through your preferred web browser in ‘
Once the plugins are done compiling, you can add the IP address of the machine hosting the phpMyAdmin page to the host discovery prompt. While this scan is running, we should be able to see the Splunk Indexer have more events concerning ModSecurity logs:
We can then perform further in-depth scans, if necessary, but this is optional for our purposes.
ZAP
ZAP can be downloaded from the Zaproxy website. You can download either the tarball or the installer; in this case we used the installer:
# Change execution permissions on file:
chmod +x <zap_file.sh>

# Execute file
./<zap_file.sh>
ZAP can then be found and executed by searching through your applications. Once you have chosen your preferred configurations, we can begin an automated scan against our web application. This can be done through the central section, underneath the Quick Start tab:
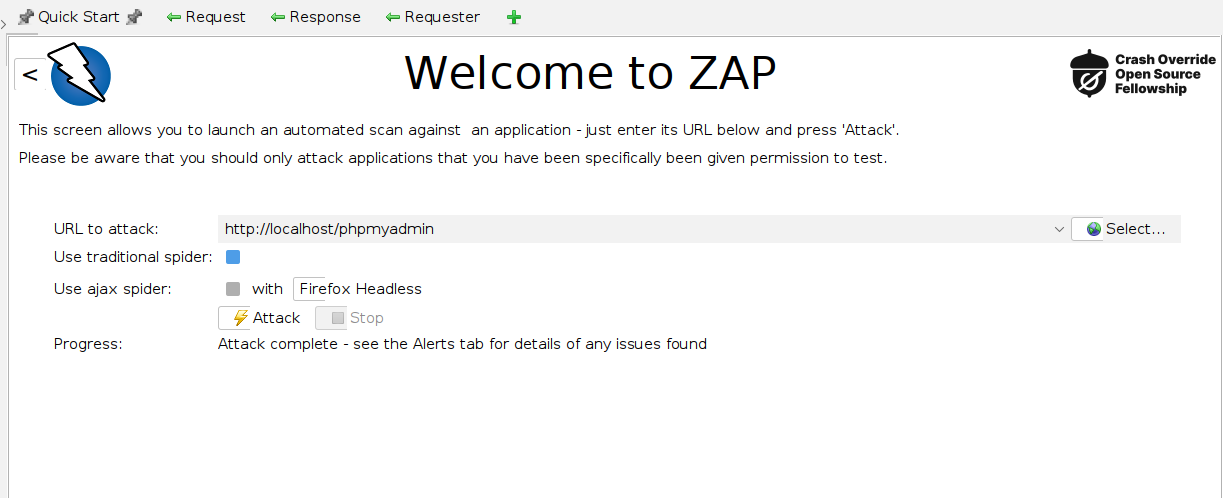
From here we can specify the URL to do the scan on, which in this case will be http://locahost/phpmyadmin Then the scan can be started with the Attack button. While it is performing the scan we should be able to see more logs being fetched by the Splunk Indexer. Feel free to explore the alerts provided, which can give insights into potential security issues within the application. These alerts detail the nature of each vulnerability, its location, and recommendations for mitigation, aiding in prioritizing and addressing security weaknesses effectively:
Splunk Alert Configuration
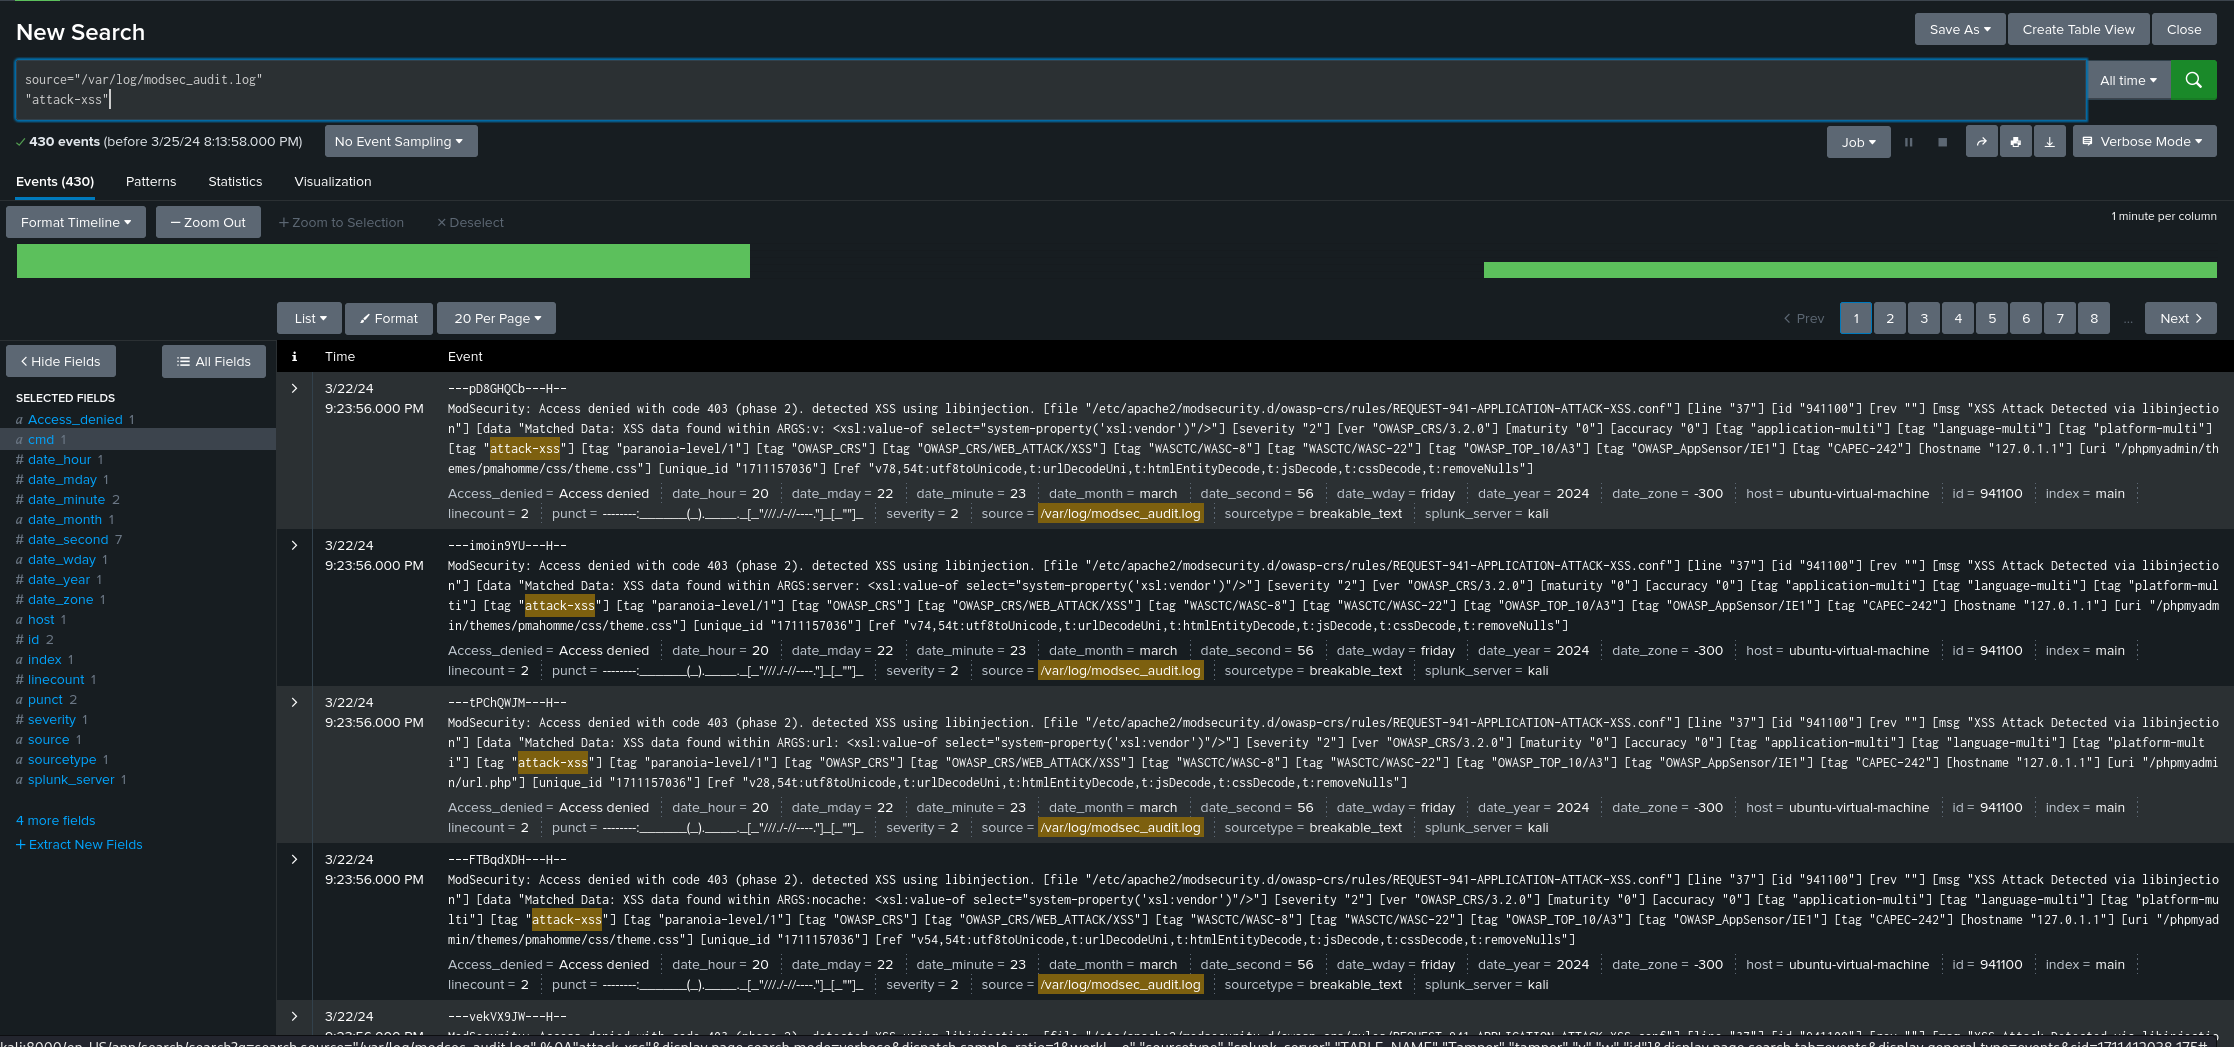
Now that we have a larger supply of logs, we can start to parse through them to create searches that would be optimal given our circumstances. For us to do this we must further understand the ModSecurity logs. Here is one example:
This is one log produced when we did some scans with ZAP, and provides us with interesting fields to use in Splunk, such as XSS , libinjection , severity “2” , and id “941100” .
By looking at more logs we can notice the same patterns being produced, with some variations depending on the attack type, severity, attack location, etc. This allows us to create some searches that could potentially serve as a basis for Splunk alerts:
- SQL Injection Attempt:
- “attack-sqli”
- Cross-Site Scripting Attacks
- “attack-xss”
- High Severity Events
- severity=”2”
- Specific Rule ID Triggers
- id=”942190”
- Access Denied Events
- “Access denied”
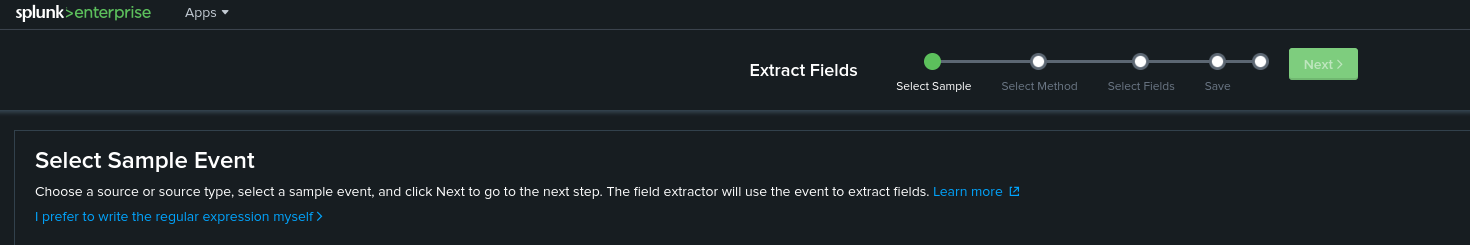
While Splunk does provide a set of fields that can be used effectively, it can also be useful to Extract New Fields, to provide greater functionality for our searches. Take for example the field severity. To add it we simply click the + Extract New Fields under the selected fields on the left-hand side of the screen and follow along the Splunk provided steps. If you are familiar with regular expressions, you can also directly write the regular expression:
For the severity field, we can use the following regex to extract the field from the logs, while also permitting us to search according to severity level:
\[severity\s*"\s*(?<severity>[^\"]+)
To create alerts, we must first input our desired search and verify that we are receiving the wanted output:
Then we can click on the Save As button on the right-hand side, choosing the Alert which then brings us to a few settings:
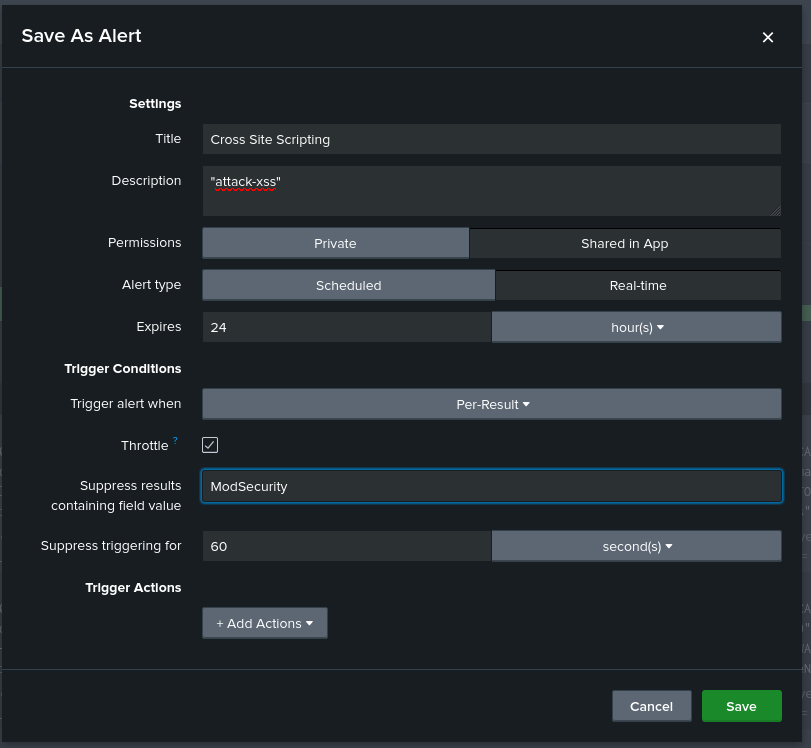
The first two fields should be filled in according to the description of the search. Next, the permissions can be set to Shared in App to make the alert available to other users within the same app while Private can be used for personal or sensitive alerts. The Alert type for this case would be set to Real-time, as Cross Site Scripting can be a critical security threat. A Expire time of 24 hours would also be appropriate, giving enough time for such an event to be responded to. Next, we have the trigger condition, which should be set to Per-Result, given our critical security threat concern. However, we should enable the Throttle option to prevent alert fatigue, setting a key identifier, “ModSecurity” so that when this is repeated in subsequent alerts within the throttle period, it will be suppressed. Still, we do not want the throttle period to be so long that we miss alerts, so we can set it to 60 seconds.
Then we can choose an action to be performed when this alert is triggered. For the purposes of this demonstration, we will choose to send an email:
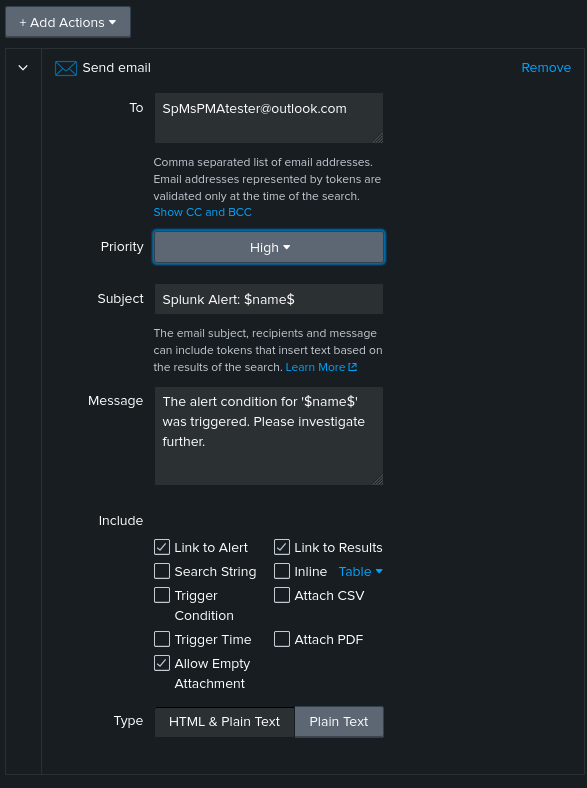
Once done, we can save the alert and rerun the ZAP scan to test if our alert configuration is working correctly. Feel free to continue making alerts/reports depending on your needs and interests.
Performance Evaluation
It is hard not to praise the effectiveness of this SIEM solution, leveraging Splunk Enterprise and Splunk Forwarder for seamless integration with ModSecurity. Splunk’s intuitive setup process and robust log parsing capabilities facilitated the aggregation and analysis of ModSecurity logs, enabling real-time monitoring and detection of security threats. Furthermore, Splunk’s ability to generate comprehensive reports based on parsed logs provided valuable insights into security incidents, streamlining incident response workflows.
Despite the seamless interaction between ModSecurity and Splunk, it is important to note the existence of challenges related to hardware requirements for real-time alerting. Splunk’s advanced analytics and real-time monitoring capabilities demanded substantial processing power and storage capacity, potentially limiting scalability in environments with resource-constrained hardware. While Splunk excelled in parsing through logs and generating actionable insights, organizations must carefully assess their hardware capabilities to ensure optimal performance and scalability.
Moving forward, efforts to optimize resource utilization and explore alternative deployment options, such as cloud-based solutions or hardware upgrades, could mitigate the impact of hardware limitations. By addressing these challenges and leveraging Splunk’s robust features, it is entirely possible to maximize the effectiveness of implemented cybersecurity solutions while minimizing the impact of hardware constraints on real-time alerting and incident response.
Conclusions and Recommendations
In conclusion, this project has demonstrated the significant benefits of integrating Splunk Enterprise and ModSecurity as integral components of the cybersecurity strategy for securing the PHPMyAdmin application. The synergy between Splunk’s advanced analytics capabilities and ModSecurity’s robust web application firewall features has strengthened the security posture of the application, enhancing its resilience against cyber threats.
Based on this evaluation and analysis, several key conclusions can be drawn. Firstly, the implemented solution has proven to be highly effective in detecting and mitigating security threats in real-time, thereby minimizing the risk of unauthorized access, data breaches, and other malicious activities. Secondly, the system’s scalability and responsiveness under varying workloads have been commendable, ensuring reliable performance even in the face of escalating cyber threats and fluctuations in traffic patterns.
Moving forward, several measures to further enhance the effectiveness and resilience of the cybersecurity solution are recommended. Continuous monitoring and analysis of security logs, threat intelligence feeds, and system performance metrics will be essential to stay ahead of evolving threats and vulnerabilities. Additionally, regular updates and patches to security configurations, along with ongoing training for security personnel, will help maintain the solution’s effectiveness over time.
In summary, this project underscores the critical importance of proactive cybersecurity measures in safeguarding web applications against an increasingly sophisticated threat landscape. By leveraging cutting-edge technologies and best practices, organizations can enhance their security posture, protect sensitive data, and ensure business continuity in an ever-evolving digital environment.
References
For further reading
-
ModSecurity2 Installation/Configuration
ModSecurity can be installed via the terminal with the following command:
# ModSecurity installation: sudo apt install libapache2-mod-security2 -y # Apache2 headers activation: sudo a2enmod headers # Restart service: sudo systemctl restart apache2As a WAF, ModSecurity requires rules to function, so we can make use of the OWASP ModSecurity Core Rule Set to ensure the proper application of security measures:
  # Delete current rule set:
  sudo rm -rf /usr/share/modsecurity-crs

  # Install git we can clone the OWASP-CRS GitHub repository
  sudo apt install git

  # Clone OWASP-CRS Github repository into corresponding directory
  sudo git clone https://github.com/coreruleset/coreruleset /usr/share/modsecurity-crs

  # Rename configuration files:
  sudo mv /usr/share/modsecurity-crs/crs-setup.conf.example /usr/share/modsecurity-crs/crs-setup.conf

  # Rename default request exclusion rule file:
  sudo mv /usr/share/modsecurity-crs/rules/REQUEST-900-EXCLUSION-RULES-BEFORE-CRS.conf.example /usr/share/modsecurity-crs/rules/REQUEST-900-EXCLUSION-RULES-BEFORE-CRS.conf

  # Remove .recommnded extension from ModSecurity configuration file:
  sudo cp /etc/modsecurity/modsecurity.conf-recommended /etc/modsecurity/modsecurity.conf
Then we can turn on the Security Rule Engine from the
etc/modsecurity/modsecurity.conffile:# On line 7: # Change: SecRuleEngine DetectionOnly -> SecRuleEngine On # Save and quitNext, we must be sure that the Apache2 service is considering the directory of the appended Core Rule Set by modifying the
/etc/apache2/apache2.conffile:# Underneath our previously added 'Include /etc/phpmyadmin/apache.conf' we add: <IfModule security2_module> Include /usr/share/modsecurity-crs/crs-setup.conf Include /usr/share/modsecurity-crs/rules/*.conf </IfModule> #Save and quitThis must also be done to our
/etc/apache2/sites-enabled/000-default.conffile:# Include Security Rule Engine on: SecRuleEngine On # Include the Core Rule Set: <IfModule security2_module> Include /usr/share/modsecurity-crs/crs-setup.conf Include /usr/share/modsecurity-crs/rules/*.conf </IfModule> # Save and quit # Restart service sudo systemctl restart apache2 - Akamai - phpMyAdmin setup
- Akamai - Apache2 with ModSecurity WAF
- ModSecurity3 Setup
- Splunk Documentation
Additionally, while Splunk can be a game-changer for beefing up any cybersecurity operation, it’s hard to deny that it can be quite costly. And yes, you can use the free version, but it does not offer as much functionality as the fully priced version, leaving out critical components like alerts. While it can be good for organizations that can afford the price, if you are an individual looking to harden your operation, i would recommend Wazuh. Free and open source are hard to beat, especially if they offer great functionality. Check out the following if you are interested:
Feel free to check out my other projects for more detailed guides!